

Private equity tracking is the continuous process of combining fund-level cash-flow reporting with look-through, company-level KPIs and an automation layer to measure returns, manage liquidity, and detect performance drift. Must-track metrics are IRR, TVPI, and DPI/MOIC, pulled from fund reports, portfolio company accounts, and administrator or API feeds. The best programs pair monthly operational checks with quarterly LP reporting, so problems surface long before the next capital call.
TL;DR:
- Fund-level cash flow monitoring is essential for understanding liquidity timing and comparing performance to peers, especially when unfunded commitments pose future risks.
- Company-level KPIs, such as operating results and thesis validation, are crucial for detecting underlying value creation or deterioration within portfolio companies.
- Relying solely on metrics like TVPI or IRR can be misleading if reported gains are unrealized or inflated by valuation policies, requiring careful interpretation.
- Automating data ingestion, normalization, and reconciliation reduces errors and enables faster identification of covenant breaches, thesis drift, or concentration risks.
- Cross-border coordination and standardized reporting templates improve transparency and enable better risk management and decision-making for family offices managing multiple funds.
Table of Contents
- What Private Equity Tracking Actually Covers
- Core Metrics: IRR, TVPI, DPI, and MOIC Explained
- Closing the Data Gap: Sources and the Information Asymmetry Problem
- Choosing Tools: What to Automate Before You Visualize
- A Monthly-to-Quarterly Workflow That Actually Works
- What Belongs in the LP Report
- How GCA-FopFo Approaches Consolidated Family Office Monitoring
- Managing Risk Across a Private Equity Portfolio
- Macroeconomic Conditions and Their Effect on Tracking
- Legal and Regulatory Factors Shaping Data Transparency
- Building a Disciplined Allocation Review Process
- Bringing ESG Metrics Into Performance Tracking
- Where to Invest First and How to Know It's Working
- See How GCA-FopFo Brings Your Holdings Together
- Sources
- FAQ
What Private Equity Tracking Actually Covers
Effective monitoring works on two levels at once, and treating them as one job is where most LPs lose visibility. Fund-level tracking looks at cash flows between the LP and the general partner: capital calls, distributions, and reported net asset value. Company-level tracking, often called look-through monitoring, follows the operating performance of each portfolio company the fund actually owns.
Both layers matter for different reasons:
- Fund-level data answers "Is this fund performing against its peers and its own model?"
- Company-level data answers "Is the underlying business actually creating value, or is the fund's reported NAV outrunning reality?"
- Liquidity planning depends on fund-level cash-flow timing, since unfunded commitments can turn into capital calls with little warning.
- Thesis validation depends on company-level KPIs, comparing actual results to the entry model the GP underwrote at close.
- Risk detection needs both, because a fund can look healthy on paper while one or two portfolio companies quietly deteriorate.
Inside a family office, this work usually splits between an investment analyst who owns metric calculation and a controller or operations lead who owns data intake and reconciliation. Smaller offices often collapse both roles into one person, which is exactly where automation earns its keep.
Core Metrics: IRR, TVPI, DPI, and MOIC Explained
Four numbers do most of the work in private equity performance metrics, and each one answers a slightly different question.
- IRR (Internal Rate of Return) measures the annualized return on cash flows, accounting for timing. It rewards funds that return capital quickly and can look inflated in early years when little capital has actually come back.
- TVPI (Total Value to Paid-In) divides total value (distributed plus residual) by paid-in capital. A TVPI of 1.8x means the fund has generated 80% in paper and realized gains combined.
- DPI (Distributions to Paid-In), sometimes paired with MOIC, measures cash actually returned to investors relative to what they put in. DPI is the metric that cannot be fudged by a generous valuation policy.
- MOIC (Multiple on Invested Capital) is closely related to TVPI but sometimes calculated at the deal level rather than the fund level, so confirm which basis a GP is using before comparing across funds.
Pro Tip: When a GP's TVPI looks strong but DPI stays flat for several years past the fund's midpoint, treat that as a flag, not a footnote. It usually means unrealized value is doing the heavy lifting.
PME (Public Market Equivalent) analysis adds one more layer, comparing a fund's cash flows against what the same dollars would have earned in a public index. It's the closest private equity gets to an apples-to-apples benchmark, though the MSCI World Private Equity Return Tracker Index shows the limits of that comparison, since it approximates private performance using public securities and proprietary datasets rather than actual fund cash flows.
The biggest interpretation trap is vintage bias: comparing a 2021 vintage fund's IRR against a 2016 vintage ignores the very different market conditions each faced at entry and exit. Valuation policy differences between GPs create a second trap, since one manager's "conservative" mark and another's "aggressive" mark can produce wildly different TVPI figures for similar underlying businesses.
Closing the Data Gap: Sources and the Information Asymmetry Problem
Reliable private equity data analysis starts with knowing exactly where your numbers come from and where they stop being trustworthy.
The realistic sources are:
- Quarterly and annual GP reports, typically PDF-based and inconsistent in format from fund to fund.
- Fund administrator extracts, which tend to be more standardized but arrive with a lag.
- Portfolio company monthly or quarterly management accounts, when the GP shares them.
- Bank and custody feeds for cash movements tied to capital calls and distributions.
- Market data for benchmarking context, including public index trackers.
The structural problem underneath all of this is information asymmetry. GPs control the reporting cadence and level of detail, and research on informational asymmetries in US private equity confirms that LPs commonly lack the granular, asset-level look-through data needed to measure true exposure and risk. Many GP reports stop at fund-level NAV and skip the operating detail an LP actually needs to judge whether value creation is real.
Three fixes move the needle. Push for standardized reporting templates in side letters at the time of commitment, not after the fact. Ingest data through APIs wherever the administrator or GP portal supports it, instead of manually retyping numbers from PDFs. Automate financial spreading so portfolio company statements land in a comparable format regardless of which accounting system originated them.
Choosing Tools: What to Automate Before You Visualize
Every private equity fund management vendor pitch starts with a dashboard. That's backward. A polished chart built on inconsistent, unreconciled data just produces a confident-looking wrong answer faster.
The capability order that actually works:
- Ingestion and APIs to pull data from fund admin portals, GP report PDFs, and bank feeds without manual re-entry.
- Spreading and normalization so financials from different portfolio companies and different accounting conventions land in one comparable schema.
- KPI dashboards that surface IRR, TVPI, DPI, and operating metrics once the underlying data is trustworthy.
- Covenant and exception alerts that flag leverage or liquidity breaches before the quarterly report catches them.
- Value-creation plan (VCP) trackers that tie actual results back to the milestones the GP promised at entry.
- Audit trails documenting who changed a number, when, and why, which matters the moment an auditor or a family member asks.
Vendor guidance from firms like Allvue and Brownloop consistently points to automation as the lever that reduces reconciliation errors and speeds monitoring cycles, because it removes the manual re-keying step where most mistakes originate.
The build-versus-buy decision usually comes down to data governance appetite. Building an internal system gives full control over the schema but means your team owns every integration, every format change a GP admin makes, and every bug. Buying a platform trades some of that control for a maintained ingestion layer, at the cost of integration work to connect it to your existing accounts and currencies.
A Monthly-to-Quarterly Workflow That Actually Works
A workable private equity portfolio analysis cycle runs on two clocks at once: a monthly operational rhythm and a quarterly reporting rhythm.
- Ingest. Pull GP reports, administrator statements, and portfolio company financials as they arrive, rather than batching everything at quarter-end.
- Validate and spread. Normalize each document into your standard schema and flag anomalies (a sudden margin swing, a missing statement) immediately.
- Compute metrics. Calculate IRR, TVPI, DPI, and company-level KPIs once the data is clean, not before.
- Detect exceptions. Compare results against the entry model and prior period, flagging covenant breaches or thesis drift for review.
- Report to stakeholders. Consolidate into an LP-facing quarterly report and an internal monthly summary for faster decisions.
- Act. Escalate flagged issues to the GP relationship owner, adjust liquidity forecasts, or revisit allocation targets.
Monthly checks focus on cash movements and exception flags. Quarterly consolidated reports carry the full metric set and commentary. Annual reviews add an independent audit pass on valuations and process.
Unfunded commitments deserve their own line in this workflow, since they represent liquidity risk that hasn't materialized yet. Modeling scheduled capital calls against expected distributions, factoring in the pacing typical of each fund's vintage, keeps a family office from being caught short when three GPs call capital in the same month.
What Belongs in the LP Report
A useful quarterly report does more than restate NAV. It should walk through a cash-flow table, the core metric set (IRR, TVPI, DPI), commentary on top contributors and detractors within the portfolio, current covenant headroom status, and a value-creation plan update tied back to the original investment thesis.
Benchmarking adds context but requires caution. Vintage-year comparisons against peer funds are the most defensible approach, since they control for the market conditions at entry. Index-based approaches like the MSCI tracker are useful for a directional sanity check but differ materially from actual fund returns due to valuation timing and liquidity premia baked into public securities.
On format: ILPA-aligned templates make cross-fund comparison easier for LPs juggling a dozen manager relationships. Whatever template you use, build in drill-down capability, so a summary number can be traced back to its source document, and keep an audit trail on every material adjustment.
How GCA-FopFo Approaches Consolidated Family Office Monitoring
Everything above assumes one hard thing: getting scattered GP reports, portfolio company statements, and bank feeds into a single, reconciled view. That's the specific gap GCA-FopFo's platform targets for family offices juggling multiple funds, entities, and currencies.
BoxAlong™ consolidates holdings across funds and asset classes into one ledger, so fund-level and company-level data live in the same place instead of a dozen spreadsheets. Currencida™ handles the multi-currency layer that private equity commitments almost always create, tracking exposure across physical, virtual, and crypto accounts without a separate conversion exercise. Scheduled data imports reduce the manual re-entry that causes most reconciliation errors, and audit-ready exports mean a family member, advisor, or auditor can trace a number back to its source without a phone call.
Managing Risk Across a Private Equity Portfolio
Risk in a private equity context rarely announces itself as a single bad number. It shows up as drift, a gap widening between what a GP underwrote and what a portfolio company is actually delivering.
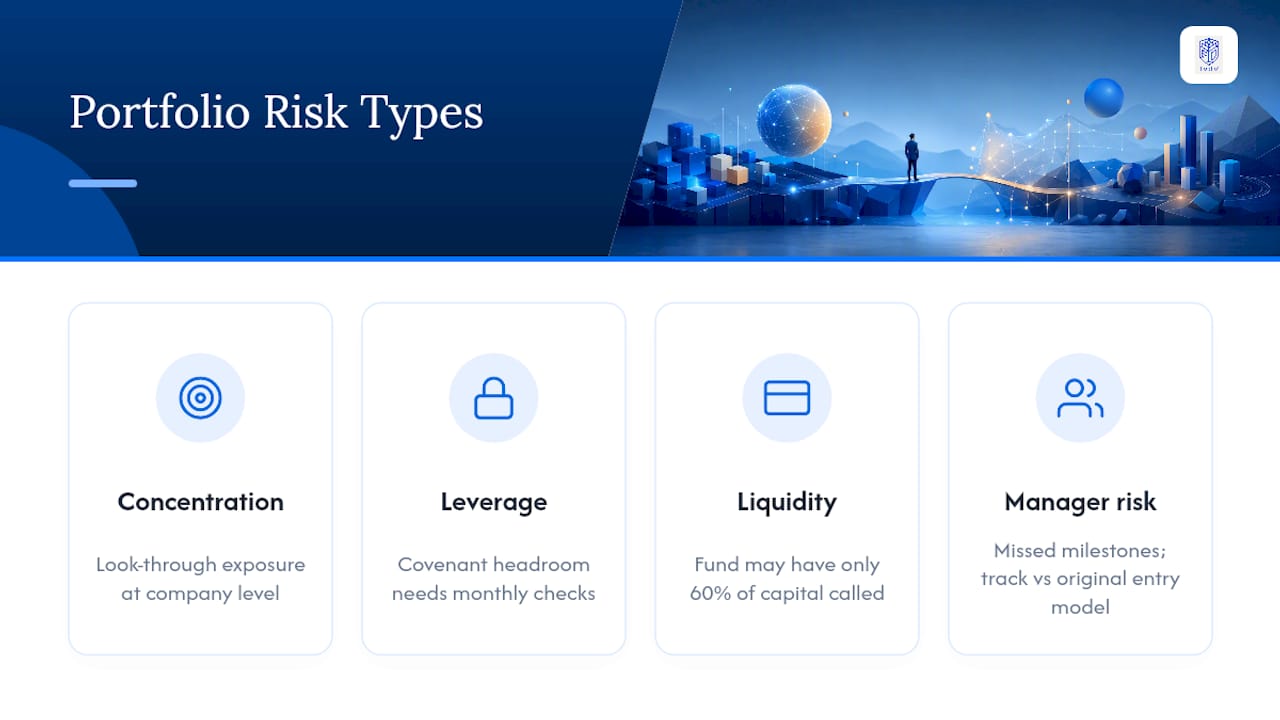
Concentration risk is the first place to look. A family office with commitments across five funds may still hold outsized exposure to one sector or one vintage year if those funds all deployed capital into similar deals. Tracking look-through exposure at the company level, not just the fund level, is the only way to catch this before it shows up in a consolidated loss.
Leverage risk sits inside individual portfolio companies. Covenant headroom, the cushion between a company's current financial ratios and the limits set in its credit agreements, deserves monthly attention rather than quarterly discovery. A revolving credit facility secured against a property portfolio illustrates how closely leveraged structures need to be watched, since covenant breaches can force asset sales or refinancing on unfavorable terms.
Liquidity risk ties back to unfunded commitments. A fund that has called only 60% of committed capital still represents a real future obligation, and family offices that ignore this in cash planning routinely get surprised by overlapping capital calls.
Manager risk, the chance that a GP's strategy or team quality has shifted since commitment, is harder to quantify but shows up in the data if you're looking: slower deployment pace, weaker deal-level reporting, or portfolio companies missing their value-creation milestones. Tracking against the original entry model turns this from a gut feeling into a documented pattern.
Macroeconomic Conditions and Their Effect on Tracking
Interest rate cycles change what your metrics mean, not just what they measure. Rising rates compress the multiples GPs can exit at, which shows up first in TVPI marks before it ever hits DPI. That lag is exactly why relying on TVPI alone during a rate-tightening cycle can mask a real problem for a year or more.
Credit market conditions matter just as much for leveraged portfolio companies. When refinancing gets more expensive, covenant headroom that looked comfortable eighteen months ago can shrink fast, which is why monitoring frequency should tighten, not loosen, during periods of credit stress.
Exit market conditions, IPO windows and strategic buyer appetite, directly affect DPI. A fund sitting on strong unrealized gains but no distributions during a closed exit market isn't necessarily underperforming. It's waiting for a market that will actually pay for those gains. Tracking macro exit conditions alongside fund-specific metrics helps distinguish a genuinely stalled fund from one simply waiting out a cycle.
Currency movements deserve a specific mention for any family office with cross-border commitments. A fund reporting strong local-currency returns can still produce a disappointing result once converted back to a reporting currency, which is exactly the kind of drift that consolidated multi-currency tracking is built to catch.
Legal and Regulatory Factors Shaping Data Transparency
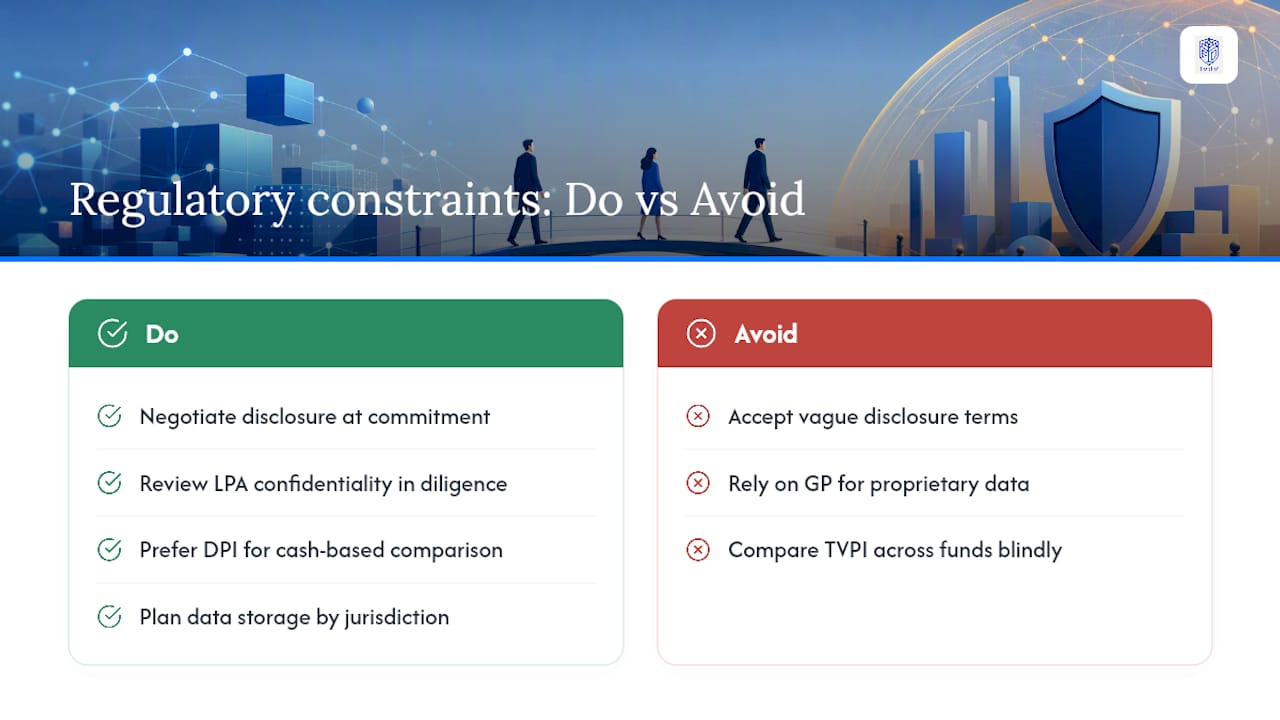
Reporting obligations vary sharply by jurisdiction and by the LP's own regulatory status, so no single rule governs what data a fund must disclose. Institutional LPs subject to fiduciary reporting requirements often negotiate more detailed disclosure rights into their side letters than an individual investor typically receives, which is one more reason to push for standardized reporting templates at the time of commitment rather than after the fact.
Confidentiality provisions inside limited partnership agreements frequently restrict how much detail a GP will share about individual portfolio companies, particularly around proprietary financial metrics or competitive positioning. This is a primary driver of the information asymmetry problem: even a cooperative GP may be contractually limited in what it can pass through to LPs. Reviewing these provisions during due diligence, before capital is committed, is the only point of real leverage an LP has to negotiate better look-through rights.
Valuation standards also carry legal weight. Funds and their administrators generally value private holdings under fair value accounting principles, but the judgment involved in applying those principles to illiquid assets leaves real room for variation between GPs. This is exactly why cross-fund TVPI comparisons need a grain of caution, and why DPI, built on actual cash received, remains harder to distort.
Data privacy rules add a newer layer, particularly for family offices operating across multiple countries. Personal financial data tied to family members or beneficial owners may fall under different disclosure and storage rules depending on jurisdiction, which matters when choosing where and how monitoring data gets stored and who can access it.
Building a Disciplined Allocation Review Process
Portfolio allocation analysis for private equity works differently than for liquid assets, because commitments made today don't convert into deployed capital for years. That lag is the single biggest reason spreadsheet-based allocation tracking breaks down.
Start with commitment-level allocation, not just deployed-capital allocation. A family office that has committed 15% of total assets to private equity but only had 9% actually called still needs to plan for the remaining 6% landing over the next several years. Reviewing allocation against commitments, rather than against current NAV alone, avoids the common mistake of thinking you have more dry powder than you actually do.
Vintage-year diversification matters nearly as much as sector diversification. Committing heavily to a single vintage year concentrates exposure to whatever market conditions existed at that specific entry point. Spreading commitments across multiple vintage years smooths out the effect of any single market cycle on overall portfolio performance.
Sector and geography concentration should be reviewed at the look-through, company level, not just at the fund label level, since two funds with different names can still end up holding similar underlying exposures. Rebalancing in private equity isn't a quick trade the way it is in public markets. It happens through the pace of new commitments and secondary market sales, so allocation reviews need to happen on a quarterly cycle to actually influence decisions before capital gets locked in for another decade.
Bringing ESG Metrics Into Performance Tracking
ESG data has moved from a side note in annual reports to a line item institutional LPs actively request, and tracking it well requires the same look-through discipline as financial KPIs.
The practical challenge is that ESG metrics rarely arrive in a standardized format. One portfolio company might report a carbon footprint calculation, another might report board diversity statistics, and a third might report neither in a given quarter. Building a monitoring process that captures whatever ESG data each portfolio company actually discloses, rather than forcing every company into an identical template, tends to produce more honest tracking than trying to standardize prematurely.
Governance metrics are the easiest ESG category to track consistently, since board composition, audit committee structure, and related-party transaction disclosure follow relatively standard patterns across portfolio companies. Environmental and social metrics vary more by industry, so a portfolio spanning manufacturing and software companies will need different measurement approaches for each.
The connection back to value-creation plan tracking matters here too. GPs increasingly build ESG improvement targets into their VCPs at entry, alongside operational and financial milestones. Tracking those ESG targets with the same rigor as revenue growth or margin improvement targets keeps them from becoming a reporting afterthought that gets dropped once the initial due diligence phase ends.
Where to Invest First and How to Know It's Working
Ingestion and normalization come before analytics, every time. A dashboard built on messy data just produces a confident wrong answer faster, and governance around who can adjust a number needs to exist from day one, not bolted on after the first audit finding.
Measure the payoff in three places: how much faster you catch a covenant breach or thesis drift, whether exit timing improves because you saw the window coming, and whether LPs or family members report more confidence in the numbers they're shown. Once spreadsheets can't answer those three questions fast enough, it's time for a unified platform.
— GCA
See How GCA-FopFo Brings Your Holdings Together
If you've been piecing together GP reports, bank statements, and a currency conversion spreadsheet just to answer "how are we actually doing this quarter," you already know the cost of fragmented tracking. Some family office platforms bring private equity commitments, currency exposure, and family holdings into one place, with flat-fee pricing that never scales with assets under management, so a growing portfolio never means a growing bill.
BoxAlong™ consolidates fund and company-level holdings into a single reconciled view, while Currencida™ handles the multi-currency reporting that cross-border private equity commitments demand. Full data ownership means your monitoring history and audit trail stay exportable and yours, not locked inside a vendor's proprietary format. Visit the solutions page to see how the four applications work together, or request a demo to walk through your own portfolio structure with the team.
Sources
For deeper detail beyond this guide, see the MSCI World Private Equity Return Tracker Index methodology, research on GP/LP information asymmetries, and Carta's practitioner guide to portfolio monitoring. For related tracking discipline, see FX exposure tracking for family offices and tracking alternative investments.
FAQ
What is the "Big 4" in private equity?
The term usually refers to the four largest global private equity firms by assets under management, a group that has shifted over time as firms grow and diversify into credit and infrastructure. For tracking purposes, firm size matters less than reporting quality. A smaller GP with strong look-through disclosure is easier to monitor than a giant with opaque reporting.
What is the 80/20 rule in private equity?
There's no single canonical "80/20 rule" specific to private equity investing.
What is the best software for monitoring private equity portfolios?
The right tool depends on whether you need fund-level LP reporting, company-level look-through detail, or both, plus multi-currency and multi-entity consolidation. For family offices juggling private equity alongside other holdings, GCA-FopFo's integrated platform consolidates holdings and currency tracking in one place; the support and update subscription runs $90 per year per account on top of the application license.
What did Warren Buffett say about private equity?
Buffett has been publicly critical of private equity fee structures and the industry's use of leverage, arguing that high fees and debt-fueled returns can overstate genuine value creation. His broader point, echoed across shareholder letters, is that investors should look past reported multiples to the actual cash returned. That view lines up directly with why DPI, which measures real cash distributed rather than paper gains, deserves more weight than TVPI alone when judging a fund's true performance.