

Family offices should report across seven KPI categories: investment performance, liquidity and cash flow, risk and exposures, operational efficiency and expense, governance and succession, compliance and tax, and family value or qualitative metrics. Start today by picking three pilot KPIs, naming an owner for each, and scheduling your first reporting cycle within 30 days.
High-priority KPIs to put on your shortlist:
-
Attribution by asset class and manager contribution (in basis points)
-
Liquidity coverage ratio (liquid assets ÷ 12-month projected outflows)
-
Consolidated net worth (across all entities, eliminating intercompany balances)
-
Expense ratio (total operating costs ÷ average AUM)
-
Drawdown and volatility (maximum drawdown, annualized standard deviation)
-
Currency exposure by denomination (% of NAV per currency)
-
Governance readiness score (succession plan completeness, trustee review dates)
-
Compliance calendar completion rate (% of filings submitted on time)
-
Net cash flow (operating + investment + financing, consolidated)
-
Stewardship index (qualitative: values alignment, next-gen engagement score)
-
Manager contribution (active return attributed to each external manager)
Recommended reporting cadence by asset type:
| Asset type | Cadence | Rationale |
|---|---|---|
| Listed equities, FX, cash | Daily / weekly | Real-time pricing available; liquidity risk is immediate |
| Hedge funds, credit | Monthly | NAV cycle aligns; semi-liquid redemption windows |
| Private equity, real estate | Quarterly | Valuation cycles; capital call and distribution timing |
| Governance, succession, compliance | Quarterly / annual | Deliberate review cadence; board or committee rhythm |
| Full portfolio attribution, 3- and 5-year rolling | Annual | Enough history to separate skill from noise |
Pick your three pilot KPIs now, assign a named owner to each, and put the first committee review on the calendar.
Key Takeaways
Effective KPI reporting for family offices requires a small, well-defined set of metrics, named owners, documented formulas, and a governance cadence that converts data into decisions.
| Point | Details |
|---|---|
| Start with three pilot KPIs | Assign a named owner to each and run three reporting cycles before scaling. |
| Document every formula | Undocumented KPIs create governance conflict; version-control every definition change. |
| Match cadence to liquidity | Daily for public markets, monthly for semi-liquid, quarterly for private assets. |
| Use attribution, not just returns | Factor analysis reveals whether active managers earn their fees or replicate cheap exposures. |
| GCA-FopFo unifies the data | BoxAlong™, Currencida™, SEBAA™, and Familigi™ map directly to the seven KPI categories in this guide. |
Table of Contents
-
KPI reporting for family offices: which metrics actually matter and how to define them
-
Data collection, dashboards, and how to keep reporting decision-ready
-
How to benchmark KPIs and turn reports into governance decisions
-
How Full Option Family Office maps to your KPI reporting needs
-
GCA-FopFo: the integrated platform for family office KPI reporting
KPI reporting for family offices: which metrics actually matter and how to define them
Over 60% of family offices now track strategic KPIs beyond investment returns, covering governance, operational, and values-based metrics. The catalogue below gives you a working definition, a typical owner, and a priority tag for each category.
Investment performance KPIs
-
Total portfolio return (net of fees): (Ending value − Beginning value + Distributions) ÷ Beginning value. Owner: CIO. Priority: Core.
-
Attribution by asset class: Decomposes active return into allocation, selection, and interaction effects. Owner: CIO / performance analyst. Priority: Core. Attribution analysis is what separates a headline return from an actionable governance signal.
-
Manager contribution (bp): Active return attributable to each external manager. Owner: CIO. Priority: Core.
-
Rolling 3- and 5-year annualized return: Smooths short-term noise. Owner: CIO. Priority: Core.
Measurement pitfall: Double-count risk is highest here. Strip intercompany loans and cross-holdings before consolidating entity-level returns into a portfolio total.
Risk and exposure KPIs
-
Maximum drawdown: Peak-to-trough decline over the reporting period. Owner: CIO / risk officer. Priority: Core.
-
Annualized volatility (standard deviation): Measures return dispersion. Owner: CIO. Priority: Core.
-
Currency exposure (% NAV per denomination): Requires multi-currency consolidation. Owner: CFO / controller. Priority: Core.
-
Concentration risk (top-5 holdings as % of NAV): Owner: CIO. Priority: Core.
-
Factor exposures (beta, duration, credit spread sensitivity): Requires factor analysis; flags when manager returns are explained by systematic exposures rather than skill. Owner: Performance analyst. Priority: Advanced.
Liquidity and cash flow KPIs
-
Liquidity coverage ratio: Liquid assets ÷ 12-month projected outflows. Owner: CFO. Priority: Core.
-
Net cash flow (consolidated): Operating + investment + financing flows across all entities. Owner: CFO / controller. Priority: Core.
-
Capital call coverage: Unfunded commitments ÷ available liquid reserves. Owner: CFO. Priority: Core.
Measurement pitfall: Currency conversion at inconsistent rates inflates or deflates cash flow figures. Fix a single conversion rate policy (month-end spot or average) and apply it uniformly.
Operational efficiency and expense KPIs
-
Expense ratio: Total operating costs ÷ average AUM. Owner: CFO. Priority: Core.
-
Cost per entity: Useful for multi-entity families; flags inefficient structures. Owner: Controller. Priority: Optional.
-
Reporting cycle time: Days from period-end to report distribution. Owner: COO. Priority: Optional.
Governance, succession, and compliance KPIs
-
Succession plan completeness (%): Scored against a defined checklist (will, trust, trustee review, next-gen readiness). Owner: Family liaison / general counsel. Priority: Core.
-
Governance meeting attendance rate: Owner: Family liaison. Priority: Optional.
-
Compliance calendar completion rate: % of regulatory filings, tax returns, and AML checks submitted on time. Owner: CFO / compliance officer. Priority: Core.
Family value and qualitative KPIs
Combining quantitative metrics with stewardship and values indicators builds a performance culture that supports both compensation decisions and succession planning. Practical examples include a next-gen engagement score (meeting attendance, education program completion), a values alignment rating (self-assessed annually by family council), and a philanthropy impact score tied to stated family mission.

How to design a KPI framework tied to family objectives
A KPI framework only works when every metric traces back to a family objective and has a named human responsible for it. Here is a repeatable process.
Step-by-step design checklist:
-
Align to family objectives. List the family’s top five strategic priorities (wealth preservation, generational transfer, philanthropy, business ownership, lifestyle). Every KPI must serve at least one.
-
Classify KPIs as core or supporting. Core KPIs go into every committee report. Supporting KPIs appear in appendices or on request.
-
Write the formula and set the baseline. No KPI is valid without a documented formula and a starting baseline measured from real data.
-
Assign a single owner. Shared ownership means no ownership. One named individual is accountable for data quality, calculation, and delivery.
-
Define targets and escalation thresholds. A target is aspirational; a threshold triggers a governance action. Both must be explicit.
-
Specify the reporting audience. The principal family, the investment committee, and the full family council each need different levels of detail.
-
Schedule a quarterly KPI validity review. Markets, family structures, and objectives change. KPI definitions that are not reviewed go stale.
Sample KPI card template:
| Field | Example |
|---|---|
| KPI name | Liquidity coverage ratio |
| Formula | Liquid assets ÷ 12-month projected outflows |
| Owner | CFO |
| Data source | Custodian statements + cash flow model |
| Cadence | Monthly |
| Target | ≥ 1.0× |
| Threshold (escalation) | < 1.0× → liquidity plan activation |
| Reporting audience | Investment committee |
| Decision trigger | Breach triggers liquidity plan review within 5 business days |
Standardizing naming conventions, KPI definitions, and a reporting calendar reduces errors and speeds month-end closes. The EFQM model offers a complementary non-financial framework for balancing governance, stakeholder, and operational metrics alongside purely financial ones.
Governance trigger examples:
-
Manager contribution below threshold for three consecutive periods → formal manager review initiated by CIO.
-
Liquidity coverage ratio below 1.0× → CFO presents liquidity plan to investment committee within five business days.
-
Succession plan completeness below 80% at annual review → family liaison schedules trustee and estate counsel meeting within 60 days.
Review KPI definitions quarterly for formula drift and annually for strategic alignment. Version-control every change: record the old definition, the new one, the effective date, and the approver.
Data collection, dashboards, and how to keep reporting decision-ready
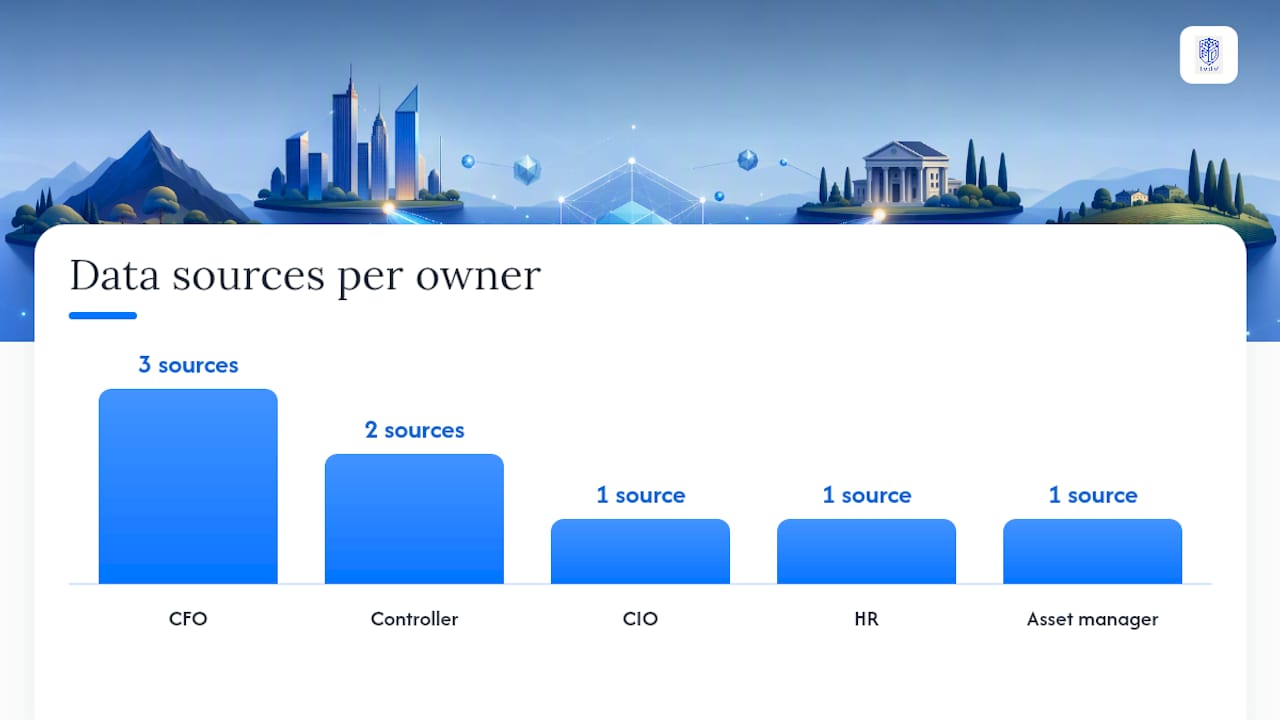
Trustworthy KPI reports start with trustworthy data. Most family offices pull from at least five source types, and each needs a designated owner.
Typical data sources and owners:
-
Custodian statements → CIO / performance analyst
-
Fund administrator NAV reports → CFO
-
Property manager rent rolls and valuations → CFO / asset manager
-
Payroll and benefits systems → HR / controller
-
General ledger and accounting system → Controller
-
Tax filings and compliance records → CFO / tax counsel
The tiered reporting model structures output by audience. An executive one-pager for the principal family covers total return, net worth, liquidity ratio, and one governance flag. The investment committee receives full attribution schedules, manager contribution tables, and risk exposures. Appendices hold raw custodian data, reconciliation logs, and entity-level detail. This structure, recommended across family office reporting best practices, keeps each audience focused on decisions within their authority.
Avoiding data silos:
-
Designate a single source of truth for each data type and document it in a data dictionary.
-
Run automated reconciliations between custodian positions and the accounting system at each period-end.
-
Set reconciliation thresholds (e.g., any break above $10,000 or 0.1% of NAV requires a sign-off before the report is distributed).
-
Log every manual override with a timestamp, reason, and approver.
AICPA SOC guidance describes the control frameworks relevant when you outsource data aggregation or reporting services. Require SOC 2 Type II reports from any vendor handling family data.
Pro Tip: Set automated variance checks that flag any position-level change above 5% of prior-period value before the report runs. Catching a data feed error at that stage costs minutes; catching it after distribution costs credibility.
Security and confidentiality are non-negotiable. Role-based access controls should limit each user to the data their role requires, and all report exports should carry watermarks and access logs. ISO-aligned information security frameworks provide useful guidance for structuring these controls in a reporting platform.
How to benchmark KPIs and turn reports into governance decisions
A KPI number without context is just a number. Benchmarking gives it meaning.
Benchmark sources to use:
-
Internal historical baselines: Your own rolling 3- and 5-year figures are the most relevant starting point.
-
Peer and survey benchmarks: Published family office surveys (from organizations such as UBS, Campden Wealth, and regional family office associations) provide peer expense ratios, return distributions, and governance scores.
-
Policy targets: Targets set in the investment policy statement (IPS) are the primary benchmark for most investment KPIs.
-
Industry standards: GIPS-compliant composites where applicable; EFQM-aligned governance scores for non-financial KPIs.
Choosing a peer group requires adjusting for asset mix and liquidity profile. Segment peer comparisons by asset class, not total portfolio, to avoid misleading conclusions.
Decision-flow examples (if X, then Y):
-
Manager contribution below the agreed threshold for three consecutive periods → CIO initiates a formal manager review; investment committee receives a recommendation within 30 days.
-
Liquidity coverage ratio below 1.0× → CFO activates the liquidity contingency plan; no new illiquid commitments until ratio recovers above 1.2×.
-
Expense ratio trending above peer median for two consecutive quarters → COO commissions a cost review; findings presented at next board meeting.
-
Succession plan completeness below 80% at annual review → family liaison schedules estate counsel and trustee meeting within 60 days.
On attribution versus headline return: Factor analysis can reveal when a manager’s return is explained by systematic factor exposures rather than skill, helping families decide whether to retain active managers or replicate those exposures more cheaply through factor-tilted index funds. Never let a strong headline return substitute for attribution. A manager who outperformed by 200 basis points but whose entire excess return is explained by a small-cap tilt is not adding active value.
When software and advisors genuinely improve KPI reporting
Independent family office surveys report a rising share (Deloitte 2024 and Eton Solutions 2024 both put it above 50%) using integrated platforms to consolidate data and shorten reporting cycles.
Feature checklist for any platform you evaluate:
-
Multi-entity consolidation with intercompany elimination
-
Multi-currency support with a configurable conversion rate policy
-
Private asset handling (capital calls, distributions, IRR calculation)
-
Attribution and factor analysis modules
-
Role-based access controls and a full audit trail
-
Automated reconciliation and variance alerts
-
Customizable report templates (executive, committee, appendix tiers)
-
SOC 2 Type II certification or equivalent assurance
Advisor roles and their limits:
-
Custodial reconciliation: best handled by the controller with platform support.
-
Attribution modeling: a performance analyst or specialist advisor adds value here.
-
Benchmark selection: the CIO should own this, with advisor input on peer group construction.
-
Governance support: a family office consultant or legal advisor, not the investment team.
Vendor selection cautions:
-
Data lock-in: confirm you can export all data in a standard format at any time.
-
Inconsistent KPI definitions: require the vendor to document every formula; never accept a black-box calculation.
-
Insufficient private asset support: many platforms handle public markets well but struggle with capital call tracking and illiquid valuations.
On the build-versus-buy question: commodity data aggregation is rarely worth building internally. Value-added analytics (attribution, factor analysis, governance dashboards) often benefit from internal ownership of the logic, even when a platform executes the calculation, because the family office retains control over definitions and methodology.
How Full Option Family Office maps to your KPI reporting needs
An integrated suite removes the most common barrier to disciplined KPI reporting: data scattered across disconnected systems. GCA-FopFo’s Full Option Family Office maps its four modules directly to the KPI categories covered in this guide.
Module-to-KPI mapping:
-
BoxAlong™ consolidates holdings and valuations across all entities, supporting consolidated net worth, concentration risk, and total portfolio return calculations.
-
Currencida™ tracks physical, virtual, and crypto accounts across currencies, feeding the currency exposure KPI and enabling a consistent conversion rate policy.
-
SEBAA™ covers payroll, benefits, savings, and investing management, providing the payroll and benefits inputs that feed expense ratio and cost-per-entity KPIs when combined with your general ledger tools.
-
Familigi™ manages family tree and genealogy data, supporting governance and succession KPIs: succession plan completeness, trustee review dates, and next-gen engagement scores.
Pilot implementation checklist:
-
Identify three pilot KPIs (recommended: total portfolio return, liquidity coverage ratio, and succession plan completeness).
-
Assign a named owner to each.
-
Connect two to three data feeds (custodian, accounting system, payroll).
-
Run three reporting cycles using the KPI card template from this guide.
-
Refine formulas and thresholds based on what the first cycles reveal, then scale.
Role-based access, 15-language coverage, and a single sign-on flow mean the family principal and the advisory team see the same data. Threshold triggered alerts on the KPIs in this guide are on the near-term roadmap.
What implementing KPI reporting actually teaches you
Most family offices that struggle with KPI reporting share the same root problem: they collected too many metrics before they understood what decisions those metrics were supposed to support.
Start with three KPIs, not thirty. Codify every definition in writing before the first reporting cycle. A KPI whose formula is understood differently by the CIO and the CFO is not a KPI; it is a source of conflict. The discipline of writing the formula down, agreeing on the data source, and naming a single owner resolves more governance friction than any dashboard feature.
Treat every report as a decision document, not an archive. If a committee meeting ends without a single action triggered by the KPI data, the report failed its purpose. The governance trigger examples in this guide exist precisely to prevent that outcome. When a manager contribution KPI triggered a formal review at one family office, the review revealed that two-thirds of the active return was explained by a persistent small-cap factor tilt, not manager skill. The family replaced the active mandate with a factor-tilted index allocation and reduced fees materially.
A formal performance culture that links KPIs to compensation and succession decisions is what separates a reporting exercise from a governance tool.
Common pitfalls to avoid:
-
Over-collecting metrics: more than 15 KPIs in a single report dilutes attention.
-
Inconsistent definitions across periods: version-control every formula change.
-
No owner accountability: a KPI without a named owner is never delivered on time.
-
Confusing headline return with attribution: the number that matters is the one that explains why.
GCA-FopFo: the integrated platform for family office KPI reporting
Managing KPI reporting across disconnected spreadsheets and custodian portals costs time and introduces the exact errors this guide is designed to prevent. GCA-FopFo’s Full Option Family Office suite brings holdings, currencies, benefits, and governance data into one unified space, so your KPI calculations draw from a single source of truth rather than five separate exports.
BoxAlong™, Currencida™, SEBAA™, and Familigi™ each address a distinct KPI category, and together they cover the full reporting framework described in this guide: from consolidated net worth and currency exposure to succession plan completeness and operational expense ratios. Automation, role-based access, and multi-language support mean the platform serves both the family principal and the advisory team without duplication of effort.
Visit the GCA-FopFo platform to see how the suite maps to your specific KPI reporting needs and to schedule an implementation conversation.
Sources
This article is general information, not a substitute for advice from a qualified financial advisor. Consult a qualified financial professional about your own circumstances before acting on anything here.
FAQ
What are the most important KPIs for a family office to report? Total portfolio return (net of fees), liquidity coverage ratio, consolidated net worth, expense ratio, and succession plan completeness are the five that most family offices should report first. Attribution by asset class and manager contribution follow once the data infrastructure is in place.
How often should a family office produce KPI reports? Match cadence to asset liquidity: daily or weekly for listed equities and cash, monthly for hedge funds and credit, quarterly for private equity and real estate, and annually for full attribution and governance deep-dives.
What is attribution analysis and why does it matter? Attribution decomposes a portfolio’s active return into allocation, selection, and interaction effects, and measures how much each manager contributed in basis points. Without it, a strong headline return can mask underperformance at the manager level or return driven entirely by factor exposures rather than skill.
How many KPIs should a family office track? Start with three to five core KPIs and expand only when each has a named owner, a documented formula, and a governance trigger. More than 15 KPIs in a single report typically dilutes committee attention rather than improving decisions.
What technology features should a family office require from a KPI reporting platform? Multi-entity consolidation, multi-currency support, private asset handling, attribution modules, role-based access controls, an audit trail, and SOC 2 Type II assurance are the non-negotiable features. Automated reconciliation and variance alerts reduce manual error and speed month-end closes.
How do qualitative KPIs fit into a family office reporting framework? Stewardship indicators, next-gen engagement scores, and values alignment ratings belong alongside financial metrics. They support succession planning and compensation decisions, and they reflect the family’s actual objectives more completely than financial returns alone.