

A family office dashboard is a unified reporting environment that pulls holdings, valuations, cash flows, and entity structures from every custodian, bank, and private-asset source into one auditable view. Five dashboards drive the most value: net worth & ownership, portfolio performance, manager oversight, cash flow & liquidity, and accounting & reconciliation. Use the checklist in the Key Takeaways section below to evaluate vendors or paste requirements directly into an RFP.
Your five dashboards at a glance:
-
Net worth & ownership — consolidated NAV plus an interactive ownership map across entities
-
Portfolio performance — time-weighted and money-weighted returns, benchmark mapping, and allocation breakdowns
-
Manager oversight — manager-level returns, fees, hurdle comparisons, and vintage cohort analysis
-
Cash flow & liquidity — short and medium-horizon forecasts, capital call projections, and stress scenario toggles
-
Accounting & reconciliation — trial-balance visibility, exception lists, and tamper-evident audit trails
Platforms like Full Option Family Office are built to deliver all five in one integrated suite. Certifications such as SOC 2 Type II (issued under AICPA guidance) and tools like Microsoft Power BI set the baseline for what you should require from any vendor.
Key Takeaways
A family office dashboard delivers its full value only when all five core views — net worth, performance, manager oversight, cash flow, and accounting — are built on a single, validated, canonical data layer.
| Point | Details |
|---|---|
| Five dashboards to prioritize | Net worth & ownership, portfolio performance, manager oversight, cash flow & liquidity, and accounting & reconciliation cover the full operational picture. |
| Data canonicalization first | Normalize your entity and security master data before building any connector to prevent costly rework across every dashboard. |
| SOC 2 Type II is the minimum gate | Request the full SOC 2 Type II report, or from smaller vendors, a documented SOC 2 control alignment plus most recent penetration test summary - for every vendor that stores or processes family financial data. |
| Phased rollout reduces risk | A small pilot (6–12 weeks) before full multi-entity rollout (3–6 months) keeps the project on budget and builds stakeholder trust incrementally. |
| GCA-FopFo covers all five layers | BoxAlong™, Currencida™, Familigi™, and SEBAA™ map directly to the five core dashboards in one integrated suite. |
Table of Contents
-
How does data aggregation work for a family office dashboard?
-
What security and compliance controls should your dashboard require?
-
How Full Option Family Office covers your dashboard requirements
Why well-designed dashboards matter for family offices
Fragmented data is the core operational risk for most family offices. Spreadsheets held by different team members, custodial PDFs arriving on different schedules, and private-asset valuations updated quarterly at best create a reporting environment where principals make decisions on stale or incomplete numbers. A well-designed wealth management dashboard replaces that patchwork with a single, defensible data layer.
RSM’s family office practice reports that integrating real-time feeds and automated reconciliation produces the largest operational gains for family offices, specifically by reducing manual reconciliation work and improving decision speed. That finding aligns with what most family office executives experience: the bottleneck is rarely analytical skill, it is data availability and trust.
The practical benefits of a purpose-built dashboard for family offices include:
-
Faster decision cycles — principals and investment committees see current positions without waiting for a weekly report pack
-
Reduced spreadsheet risk — version-controlled, system-generated reports replace manually assembled Excel files
-
Consolidated private-asset visibility — LP interests, real estate, and direct investments appear alongside public holdings
-
Better liquidity planning — projected capital calls and distributions sit next to current cash balances
-
Improved governance and audit trails — every data change, report export, and approval is logged and time-stamped
Governance expectations are rising. Trustees, auditors, and increasingly the principals themselves want to see not just the numbers but the provenance of those numbers. A dashboard built to AICPA SOC standards for service organizations gives your family office the assurance framework to satisfy that expectation.
What are the five core family office dashboards?
Each dashboard below has a distinct purpose, a specific set of metrics, and defined data sources. Treat this section as a specification template you can adapt for an RFP or an internal build brief.
Net worth & ownership
Purpose: Give principals and trustees a single, real-time view of total family wealth, including every entity layer.
Key metrics: Consolidated net asset value (NAV), entity-level balances, ownership percentages, and an interactive ownership tree showing how trusts, LLCs, and operating companies connect.
Data sources: Custodial account feeds, entity ledgers, cap tables, and real estate appraisal records.
Configuration notes: The ownership map should be interactive, allowing a principal to click any node and see the underlying holdings. Drilldowns to the position level and exportable entity schedules are both required.
Pro Tip: Map your entity structure in the data model before you connect any custodial feed. Retrofitting entity hierarchies after data ingestion is the single most common cause of project delays.
Portfolio overview & performance tracking
Purpose: Track returns across all asset classes, compare against benchmarks, and attribute performance by manager, sector, and currency.
Key metrics: Time-weighted return (TWR), money-weighted return (MWR/IRR), contribution attribution, benchmark mapping (e.g., S&P 500, custom blended benchmarks), and allocations by currency and sector. The Full Option Family Office suite stores every position, cash flow, and valuation needed to compute these, native TWR/MWR tiles are on the near -term roadmap.
Data sources: Custodial transaction tapes, pricing feeds, and FX rates. Platforms like Interactive Brokers’ PortfolioAnalyst demonstrate how broker-sourced transaction data can produce defensible TWR and MWR calculations at the account level.
Configuration notes: Show TWR and MWR in parallel on the same tile with a tooltip explaining the difference. Stoxly illustrates why formula transparency matters: principals who can see the calculation logic trust the output more.
Update frequency: Public-market positions should refresh daily; private-asset valuations on a quarterly or event-driven basis with clear “as of” date labels.
Manager performance & benchmarking
Purpose: Compare external managers on a risk-adjusted, fee-adjusted basis so the investment committee can make allocation decisions with confidence.
Key metrics: Manager-level net returns, management and performance fees, hurdle rate comparisons, IRR by vintage cohort, and peer-group percentile rankings where data is available.
Data sources: Manager-provided performance attribution feeds, custodial confirmations, and subscription/redemption records.
Configuration notes: Present manager comparisons using generic category labels (“large-cap equity manager,” “private credit fund”) rather than embedding manager names in fixed dashboard tiles, which makes the view brittle when managers change. Vintage cohort analysis for private funds should sit in a separate panel with a clear J-curve visualization.
Cash flow forecasting & liquidity management
Purpose: Ensure the family always has sufficient liquidity for capital calls, distributions, living expenses, and tax payments, across a 3-month and 12-month horizon.
Key metrics: Projected inflows and outflows by category, capital call schedules from private funds, expected distributions, liquidity buffers as a percentage of total NAV, and stress scenario outputs.
Data sources: Bank feeds, private fund capital call notices, distribution notices, and tax payment schedules.
Configuration notes: Stress scenario toggles (e.g., “delay all distributions by 90 days,” “add one unexpected capital call”) should be configurable by the investment team without requiring IT support. Suite users today model scenarios by exporting cash-flow data to Excel or Power BI, interactive in-APP toggles are planned.
Pro Tip: Build the liquidity dashboard before the manager performance dashboard. Liquidity surprises are the most operationally disruptive events a family office faces, and the data requirements are simpler to connect first.
Accounting oversight & reconciliation
Purpose: Give the CFO or controller a daily view of reconciliation status, open exceptions, and trial-balance integrity across all entities. The Suite maintains the family-office ledger of holdings, benefits, and payroll with a full audit trail; a general-ledger trial balance across operating companies still lives in QuickBooks, Sage Intact, or NetSuite, and the Suite exports feed those systems.
Key metrics: Reconciliation match rate by account, open exceptions by age and dollar value, trial-balance by entity, and journal entry approval status.
Data sources: General ledger exports (QuickBooks, Sage Intacct, or similar), custodial statements, and bank feeds.
Configuration notes: The exceptions list should be sortable by age and amount, with a direct link to the source document. Every reconciliation action must generate a time-stamped audit log entry. Report packs exported from this dashboard should carry a watermark and a generation timestamp so quarterly packs are defensible in an audit.
How does data aggregation work for a family office dashboard?
The dashboard is only as good as the data behind it. Aggregation is where most implementations succeed or fail.
Required connector types
Your integration checklist should include:
-
Custodial APIs and OFX file ingest — for daily position and transaction data from brokers and banks
-
Accounting system exports — general ledger data from QuickBooks, Sage Intacct, or NetSuite
-
Bank feeds — direct bank connections for cash visibility
-
Private asset statements — PDF or structured data from fund administrators, with manual override capability
-
Cap table sources — equity management platforms or manually maintained cap table files
-
Crypto wallet feeds — on-chain balance queries for digital asset holdings
Normalization requirements
Raw data from different custodians uses different security identifiers, date formats, and currency conventions. Your canonical data model needs to handle:
-
Security master normalization — map CUSIP, ISIN, and ticker to a single internal identifier
-
Currency translation — apply daily FX rates with a clear source (e.g., ECB or Bloomberg) and store the original currency alongside the translated value
-
Duplicate detection — flag transactions that appear in both a custodial feed and an accounting export
-
Refresh cadence — event-driven refresh for cash and public positions; scheduled batch for private assets
Automated data ingestion platforms, such as those that map uploaded fund statements to a canonical entity model, reduce the manual normalization burden significantly. The goal is a single validated data layer that every dashboard reads from, not five dashboards each pulling from their own raw feeds.
Private-asset workflow
Private assets require a separate workflow because they do not have daily market prices:
-
Ingest capital call and distribution notices from fund administrators
-
Record manual valuations at each reporting date with an attached source document
-
Apply IRR timing using actual cash flow dates, not period-end approximations
-
Log every valuation override with the approver’s name, timestamp, and supporting document
-
Publish to the dashboard with a clear “as of” label and a link to the source document
Sample ingestion-to-dashboard workflow
-
Ingest — custodial APIs, OFX files, and accounting exports load into a staging layer nightly
-
Normalize — security master matching, FX translation, and duplicate detection run automatically
-
Map to entities — positions and transactions are assigned to the correct legal entity in the ownership hierarchy
-
Validate and reconcile — automated checks flag breaks; exceptions route to the controller’s queue
-
Publish — validated data flows to all five dashboards; private-asset tiles update on their own schedule with “as of” labels
Microsoft Power BI works well as a visualization layer on top of this canonical data model when your team needs highly customizable report packs or interactive portals beyond what a purpose-built platform provides natively.
What security and compliance controls should your dashboard require?
Sensitive family data — account numbers, ownership structures, beneficiary details — demands controls that go beyond standard enterprise software. Here is the checklist to include in every vendor conversation.
Encryption and access:
-
Encryption at rest (AES-256 or equivalent) and in transit (TLS 1.2 minimum)
-
Multi-factor authentication (MFA) enforced for all users, including read-only principals
-
Role-based access control (RBAC) with least-privilege segmentation: principals see their own entities, advisors see their assigned families, external vendors see nothing beyond their scope
Auditability:
-
Tamper-evident, time-stamped logs for every data change, login, report export, and approval
-
Document watermarking on exported report packs, showing the export timestamp today, with per-recipient watermarking on the near-term roadmap
-
Report-pack provenance so quarterly packs can be traced back to the exact data snapshot they were generated from
Certifications to request from vendors:
-
SOC 2 Type II — the minimum procurement gate for any platform that stores or processes family financial data. Request the full report, not just the summary letter. AICPA’s SOC guidance for service organizations explains what the report should contain and how to read it.
-
ISO 27001 — an additional assurance layer for information security management
-
Penetration test summary — request the most recent third-party pen test executive summary and ask about remediation timelines for any findings
Data residency and SLAs:
-
For U.S.-domiciled family offices, confirm that data is stored on U.S. servers or in a jurisdiction your trustees and legal counsel have approved
-
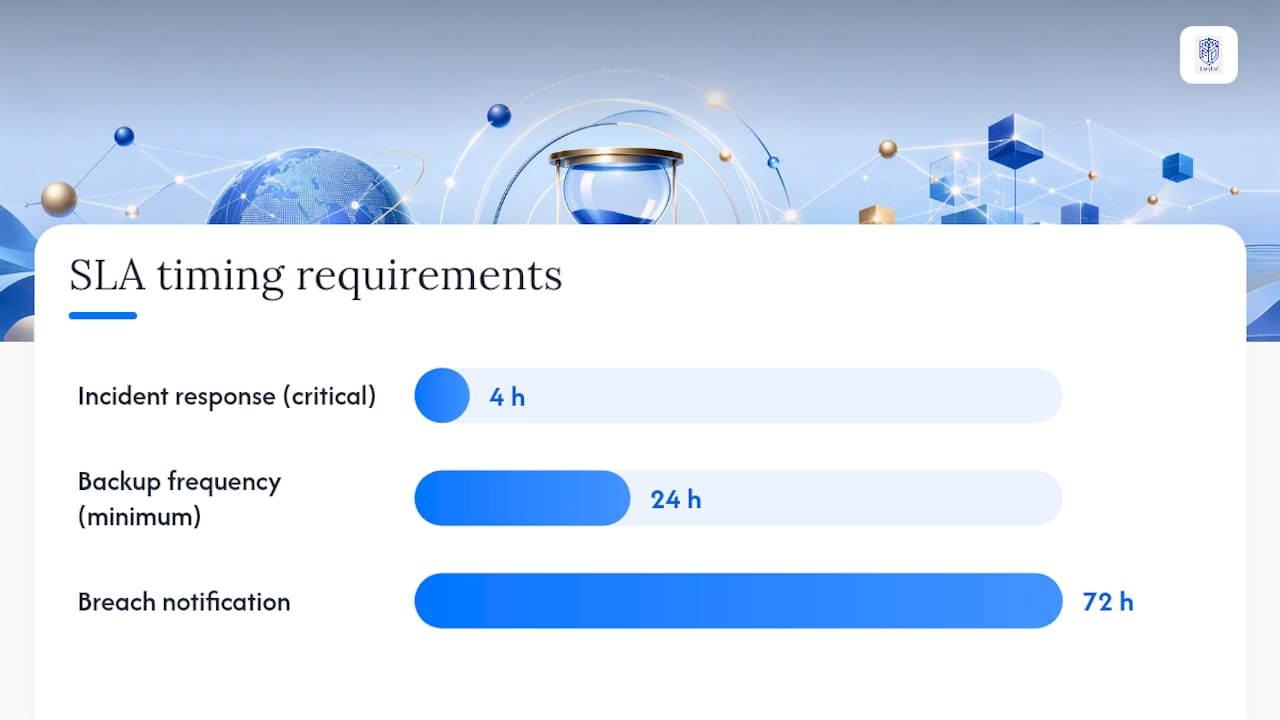
Require a written SLA covering incident response time (typically 4 hours for critical incidents) and breach notification (72 hours is the standard aligned with most U.S. state breach notification laws)
-
Confirm backup frequency (daily minimum) and recovery time objective (RTO) in the contract
What do principals expect from client-facing reporting?
The investment team and the family principals have different needs from the same underlying data. A dashboard that serves only one group will see low adoption from the other.
UX best practices:
-
Role-specific landing pages: a principal sees a net worth summary card and recent activity; the investment team sees reconciliation status and manager attribution
-
Concise executive cards with one-click drilldowns, not tables of raw data as the default view
-
Mobile-friendly principal portals so family members can check balances and recent transactions from a phone
-
Interactive drilldowns that let a principal click from total NAV down to a specific position without leaving the browser
Reporting templates to build first:
-
Executive one-page net worth pack (monthly, PDF, watermarked)
-
Manager deep-dive report (quarterly, showing net returns, fees, and benchmark comparison)
-
Cash flow forecast summary (monthly, showing 3-month and 12-month projections)
-
Trustee-level entity schedules (quarterly, showing each legal entity’s balance sheet and activity)
Personalization and adoption:
Per-principal scopes mean each family member sees only the entities and accounts relevant to them. Scheduled report packs delivered by email reduce the need for principals to log in proactively, which drives engagement without requiring behavior change. On-demand interactive PDFs give advisors a way to share a snapshot without granting direct platform access.
Adoption rarely fails because of missing features. It fails because the principal-facing view is too complex. Stage the rollout: launch the net worth summary card first, add drilldowns in month two, and introduce the full reporting suite in month three. RSM Global’s governance guidance reinforces this incremental approach, noting that change management and stakeholder engagement are as critical as the technical build.
What does a realistic dashboard implementation look like?
A phased rollout prevents the most common failure mode: trying to connect every data source and build every dashboard simultaneously, then running out of budget before anything goes live.
Phased implementation plan
-
Discovery and scoping (weeks 1–2) — document every data source, entity structure, and reporting requirement; assign roles and confirm data ownership
-
Data mapping and cleanup (weeks 3–5) — audit existing data for completeness and accuracy; resolve entity naming inconsistencies before any connector is built
-
Connector build and testing (weeks 6–9) — build custodial and accounting integrations; run parallel reconciliation against existing reports to validate accuracy
-
Pilot dashboards (weeks 10–12) — launch net worth and cash flow dashboards with a small group of internal users; gather feedback before full rollout
-
Full rollout and training (months 4–5) — deploy all five dashboards; run role-specific training sessions for principals, investment staff, and the controller
-
Ongoing support and maintenance — establish a monthly data quality review, a quarterly dashboard review with stakeholders, and a clear escalation path for data issues
Roles and ownership
-
Family office CIO/COO — executive sponsor; approves scope, budget, and go-live criteria
-
Data engineer or integration vendor — builds and maintains connectors; owns the canonical data model
-
External implementation partner — project management, configuration, and training
-
Compliance lead — reviews audit log requirements, data residency, and vendor certifications
-
Product/IT support — manages user access, MFA enrollment, and ongoing platform updates
Timeline and cost drivers
A small single-family office pilot typically takes 6–12 weeks. A full multi-entity rollout runs 3–6 months. Complex private-asset integrations can add 4–8 weeks to either timeline.
The primary cost drivers are:
-
Number of custodial connections (each adds integration and testing time)
-
Volume of private-asset manual work (fund statements requiring manual ingestion)
-
Custom ETL requirements (non-standard data formats from legacy accounting systems)
-
Number of user seats and branded principal portals
-
Licensing model: annual subscription versus one-time license plus maintenance
A dashboard deployment in practice: before and after
This anonymized example reflects a composite of typical single-family office implementations.
Before: A single-family office with holdings across four custodians, two operating companies, and a private equity portfolio was producing monthly report packs manually. The process took approximately three business days per month, involved five separate spreadsheets, and produced reconciliation errors in roughly one in four reporting cycles.
After implementation:
-
Connected four custodial feeds and two accounting system exports to a canonical data layer
-
Launched the net worth and portfolio performance dashboards in week 10 of the pilot
-
Added the cash flow and accounting reconciliation dashboards in month four
-
Trained principals on the executive portal; trained the investment team on the full workspace
Results: Monthly report pack production time dropped from three days to under four hours. Reconciliation errors fell to near zero because exceptions were flagged automatically rather than discovered manually. Principals began checking the net worth summary card weekly without prompting.
Lessons learned:
-
Data cleanup took twice as long as scoped. Entity naming was inconsistent across custodians, and resolving it before building connectors saved significant rework later.
-
The principal portal drove more engagement than expected once it was simplified to a single summary card with one-click drilldowns.
-
The manager performance dashboard was deprioritized to phase two, which was the right call. Getting the data foundation right first made the manager analytics far more reliable.
-
Governance documentation (who can approve a manual valuation override, who can export a report pack) should be written before go-live, not after.
Pro Tip: Canonicalize your entity and security master data in week one. Every dashboard, every connector, and every report template depends on it. Skipping this step is the most expensive mistake you can make on a dashboard project.
What GCA-FopFo’s perspective is on dashboard implementation
At GCA-FopFo, we have worked with families and financial advisors navigating the exact complexity this guide describes: multiple custodians, layered entity structures, private assets with irregular valuations, and principals who need clarity without complexity.
Governance and ongoing support are not afterthoughts in our approach. A dashboard that goes live without a clear data quality review cadence, a defined escalation path, and a trained internal owner tends to drift. We build those processes into every engagement from the start, because the platform is only as valuable as the discipline around it.
How Full Option Family Office covers your dashboard requirements
Your five dashboards map directly to the GCA-FopFo suite. Each module was built for a specific layer of family wealth management, and together they form a complete financial portfolio dashboard without requiring a separate BI tool for the core use cases.
-
BoxAlong™ handles holdings and NAV consolidation across asset classes, feeding the net worth and portfolio performance dashboards with position-level detail; performance metrics(TWR/MWR) can be computed from the exported dataset or via the native tiles on the roadmap
-
Currencida™ tracks physical, virtual, and crypto accounts across currencies, giving your cash flow and multi-currency performance views up-to-date balances (as fresh as the last statement you upload)
-
Familigi™ maps your family tree and entity ownership structure, powering the interactive ownership map that trustees and principals rely on
-
SEBAA™ manages payroll, benefits, and savings ledgers, connecting the accounting and reconciliation dashboard to compensation and benefits data in one place
The suite includes role-based access control, MFA, tamper-evident audit trails, secure backups, and 15-language support including right to left. Ask us for our current security posture summary; formal SOC 2 Type II audit is planned. For teams that need highly customizable report packs, the platform’s data layer is compatible with external visualization tools including Microsoft Power BI.
Explore the Full Option Family Office suite to request a demo or download an RFP-ready spec sheet. Your implementation conversation starts there.
Sources
These sources support the technical and assurance conversations you will have with vendors and implementation partners. Use them as starting points, not final answers — your specific custodians, entity structures, and compliance requirements will shape the details.
This article is general information, not a substitute for advice from a qualified financial advisor. Consult a qualified financial professional about your own circumstances before acting on anything here.